
Production data is one of the most powerful tools in commercial poultry operations, but the biggest opportunity is in how it’s integrated and applied to improve performance.
Most producers are already collecting numbers every day for feed intake, water intake, mortality, egg production, body weight, barn temperature, lighting schedules. Ammonia readings. The list can get long fast.
The real question isn’t whether the numbers exist. It’s whether those numbers are being used to make informed decisions.
When integrated effectively, production data can help producers better understand what’s happening in a flock, identify small issues before they become bigger challenges and make more informed decisions to improve bird performance.
Production Data Tells the Story Behind the Flock
One data point by itself doesn’t always tell the full story. A single day of egg production, water intake or mortality may look normal until it’s compared against previous days, previous flocks or breed standards. Data becomes more useful when it starts to show patterns.
For example, a layer flock may appear to be performing well if egg production looks strong at the end of the week. But if feed intake has started fluctuating and trending down, it may point to a challenge that doesn’t show in egg production data for another week. Looking at multiple data points and how they are trending can help producers project and plan for the future of their flock.
The same is true for mortality, production, body weight and water consumption. A small change might not raise concern on its own, but when that change continues over several days or weeks, it can point to a challenge that needs attention.
Production data isn’t meant to replace walking birds and looking at bird activity, behavior, litter conditions, feed and water access, bird distribution, signs of stress and overall flock appearance. Data helps support those observations by giving producers a clearer view of what’s happening over time.
What Numbers Should Poultry Producers Track?
The short answer, if it’s measurable, it’s worth tracking.
Some of the most important production and barn data points include:
- Feed intake
- Water intake
- Mortality
- Egg production
- Body weight
- Average daily gain
- Uniformity
- Feed conversion
- Barn temperature
- Lighting schedules
- Ammonia levels
- Ventilation changes
- Feed changes
- Water additive or product use
- Timing and cause of mortality
Many modern barns already collect some of this information through automated controllers, barn scales, bin scales, water meters and environmental sensors. That makes data collection easier, but it still needs to be organized in a way that’s useful.
For many producers, that may be as simple as entering daily records into an Excel sheet and using graphs to show trends. Graphing production data makes it easier to see small changes, especially in parameters such as lay percentage, feed intake, water intake, egg size and body weight
Use Benchmarks, But Know Your Own Flock History
Breed standards are a helpful place to start when analyzing production data. These guides are usually available through your breeder company, hatchery, integrator or genetic supplier and provide target curves for body weight, feed conversion, egg production and other performance measures. These benchmarks can help producers see whether a flock is on track, behind or ahead of expectations.
However, breed standards aren’t the only thing that matters.
Each barn has its own history. Each operation has its own management style, environment and goals. A producer who has raised multiple flocks in the same barn can begin to compare performance of their current flock against past flocks.
That comparison can answer important questions:
- Is this flock following the same pattern as previous flocks?
- Are challenges being seen at the same timepoint across flocks?
- Is seven-day mortality consistent?
- Is there a recurring slowdown around a certain point in grow out?
- Did performance improve after a management or nutrition change?
Once those patterns are identified, producers can then develop plans around mitigating any challenges. Additionally, this allows producers to evaluate how effective their intervention is. By using these benchmarks, producers can understand how cost effective their solutions are and aim for incremental improvements with every flock.
Small Changes Can Point to Bigger Issues
Production data is especially useful when it helps catch subtle changes before they become bigger problems.
Water intake is a good example. Birds naturally drink more as they grow, and intake may rise when barn temperatures increase. But if water intake drops unexpectedly or doesn’t follow the normal daily pattern, it may point to a problem with lighting, health, temperature, equipment or feed intake.
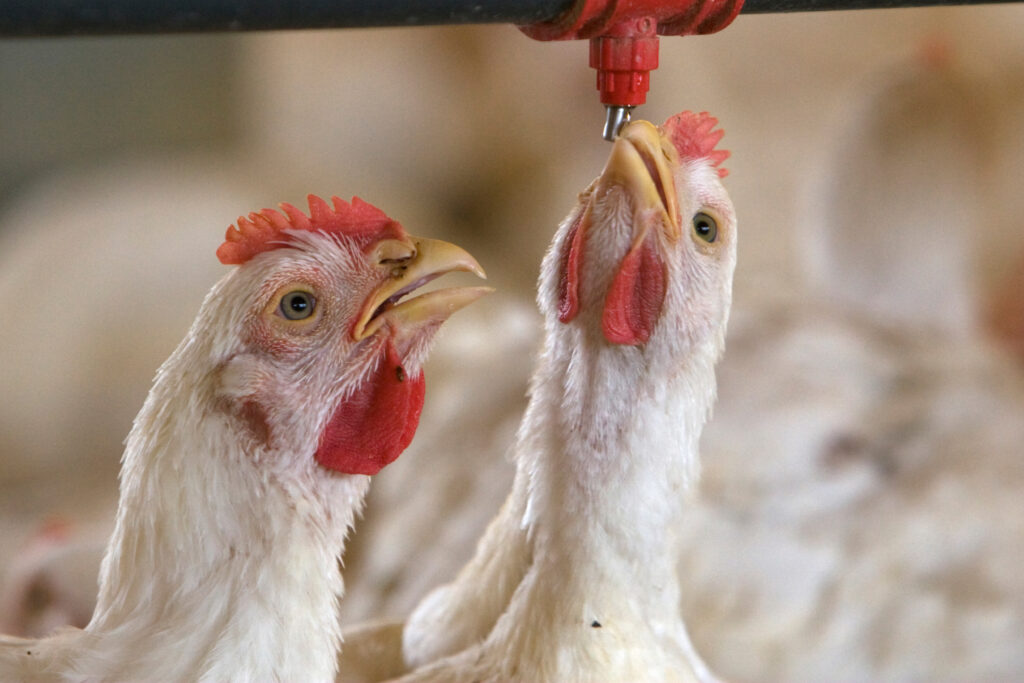
In one barn, a Ralco producer noticed water consumption had dropped and discovered one section of the water line wasn’t delivering water to the nipples. Because water intake was being tracked, they were able to catch the issue and correct it before it created a larger challenge.
Mortality can work the same way. Picking up two birds one day, four the next and seven the day after may not feel dramatic at first. But when those numbers are recorded, the trend becomes easier to see.
In another barn, a Ralco producer noticed mortality slowly creeping up. After taking a closer look and doing necropsies, they weren’t finding a major bird health issue. The real problem ended up being a malfunctioning nest box gate that wasn’t opening correctly, which kept birds from getting in and created stress in the flock.
Data Can Help Identify Equipment and Barn Issues
Not every production change starts with the bird. Sometimes, the numbers point back to the barn.
In one layer flock, mortality increased because of pecking and cannibalism. When the data was reviewed more closely, most of the losses were coming from birds in the top row of cages. That pointed to a likely light stress issue. After the top row of birds were moved down, mortality returned closer to what the producer had been seeing before.
A sudden increase in feed use could be related to bird intake, but it could also mean an auger is spilling feed. A change in water use could mean birds are drinking more, or it could mean there is a leak somewhere along the water line. A temperature issue may not mean the whole ventilation system failed. It could be one fan belt, one vent or one sensor creating a problem.
This is where alarms and barn monitoring systems can be valuable. When water use, temperature or ventilation moves outside of the normal range, an alarm can help producers respond quickly.
Even small changes that don’t trigger an alarm are worth watching. A gradual shift in temperature, ventilation or water intake may be an early warning sign that something needs maintenance. Catching those problems early can save birds, time and money.
Record What Changed Between Flocks
Production records become even more valuable when they include notes about what changed between flocks. This could include a feed program change, an adjusted lighting schedule, administration of a water additive or a severe weather event.
Without those notes, it can be hard to connect a performance change to a possible cause. This is especially important when feed changes, water additives or other management adjustments are made.
For example, a producer added a water additive to support birds through a general health challenge. A few weeks later, feed intake seemed lower than expected. When the data was graphed, it showed that consumption stopped increasing at the expected rate after the additive was administered. After reviewing the application rate, the producer found it had been added at about seven times the recommended label rate.
Good data doesn’t just show what happened, it helps explain why it may have happened.
Mortality Timing Matters
Mortality is one of the most important numbers to track, but the timing of mortality matters just as much as the total.
Two flocks may both finish with similar mortality totals, but the story behind those losses can be very different. One flock may lose most of those birds in the first seven days. Another may experience losses later in grow out. Another may have late mortality tied to heat stress close to processing.
Those differences matter when evaluating flock efficiency and profitability.
Late mortality can have a major impact on feed conversion because those birds have already consumed a large amount of feed. In broilers and turkeys, losing heavy birds close to processing can be especially costly.
Many producers record mortality numbers, but taking the next step to evaluate birds through necropsy can help identify what may be driving those losses. This gives producers a clearer picture of the challenge and helps them make more accurate decisions instead of treating every mortality spike the same way.
For more support, producers can also use our necropsy blog and video to better understand what to look for when evaluating bird health.
Data Doesn’t Have to be Complicated
For producers who don’t love spreadsheets, data collection can feel overwhelming. But it doesn’t need to be complicated.
Start with the numbers that matter most to your operation. Record them consistently. Put them into a format you can easily read. Once you have a sheet or system that works, use it flock after flock. The key is consistency.
Ready to turn your production data into practical action? Call 1-800-533-5306 or email PoultryHelp@RalcoAgriculture.com to connect with Ralco’s Poultry Team.
Want to dig deeper? Check out this Wing it Wisely podcast, where the Ralco Poultry Team talks through what numbers to track and how to turn flock data into action.